What originally started as a 2018 hackathon project turned into an evergreen product that brings personalized value to Pandora listeners. In return, users listen even more to pump their stats.
My responsibilities included an abbreviated product design process and heavier focus on visual design:
Ideation and brainstorming with Data Science team
Secondary research on other Year in Review products
Clear communication and collaboration with PM and engineering managers to set and understand MVP priorities
UX flow explorations and UI design iterations on leading to VP approval
Redlining and design spec hand-off for engineering
Pre-launch design QA and support with engineering and product
In October 2018 a week before a yearly hackathon, a discussion with the Data Science team and a PM went something like:
Me: ”Spotify Wrapped is pretty cool, we should do that and also use the Music Genome Project to provide super cool insights.”
PM: “We won’t have resources for a project on that scale, especially this late into the year.”
Me and Data Science team: ”Cool, we’ll do it for a hackathon”
After a hackathon week of miracles and extremely close collaboration, we put together the first prototype for Your 2018, our first version of a year-in-review product that looked like this:
Your 2018
Branding and visual design were heavily borrowed from 2018 EOY assets from the Creative department. Grid system used for responsive sizing and to allow for 2-up, 3-up, 4-up, and 5-up column systems.
Following the great reception from the Hackathon, we squeezed this into the roadmap and launched in the first week of December, just before the EOY.
During our retrospective, we observed that listeners who accessed their Your 2018 showed a statistically significant increase in Minutes Listened the following month in January. We also made note that a project like this would benefit greatly from more time to plan and develop, so in 2019 we started the same effort but at the start of Q3.
I collaborated closely with the Data Science team on new stats we could share and how to provide additional value to our listeners. Creative was also more closely integrated to create a brand experience that matched creative’s EOY push.
The end result was a richer interactive experience, now branded “Playback 2019.”
Playback 2019
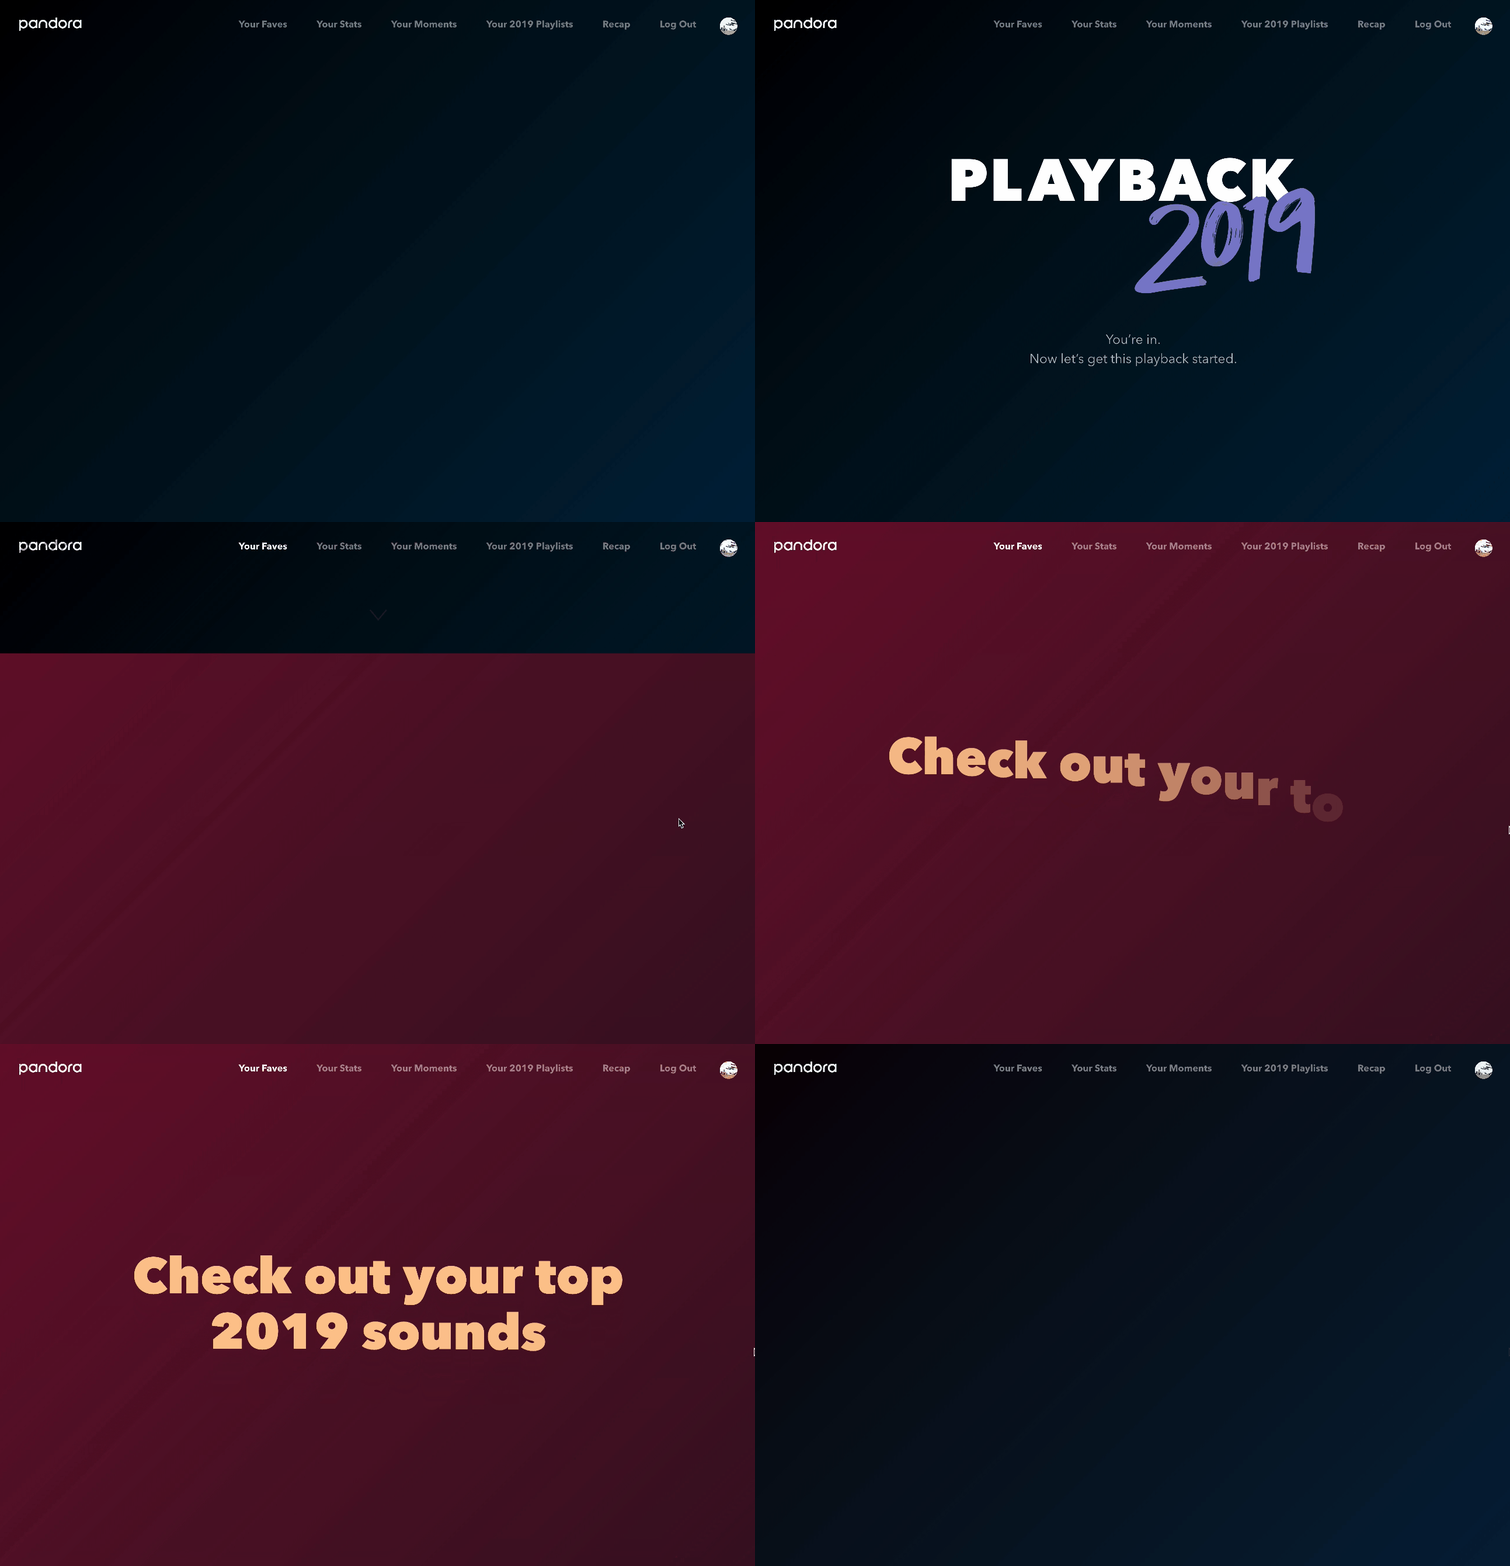
Welcome
Intro title page and transition page into Faves
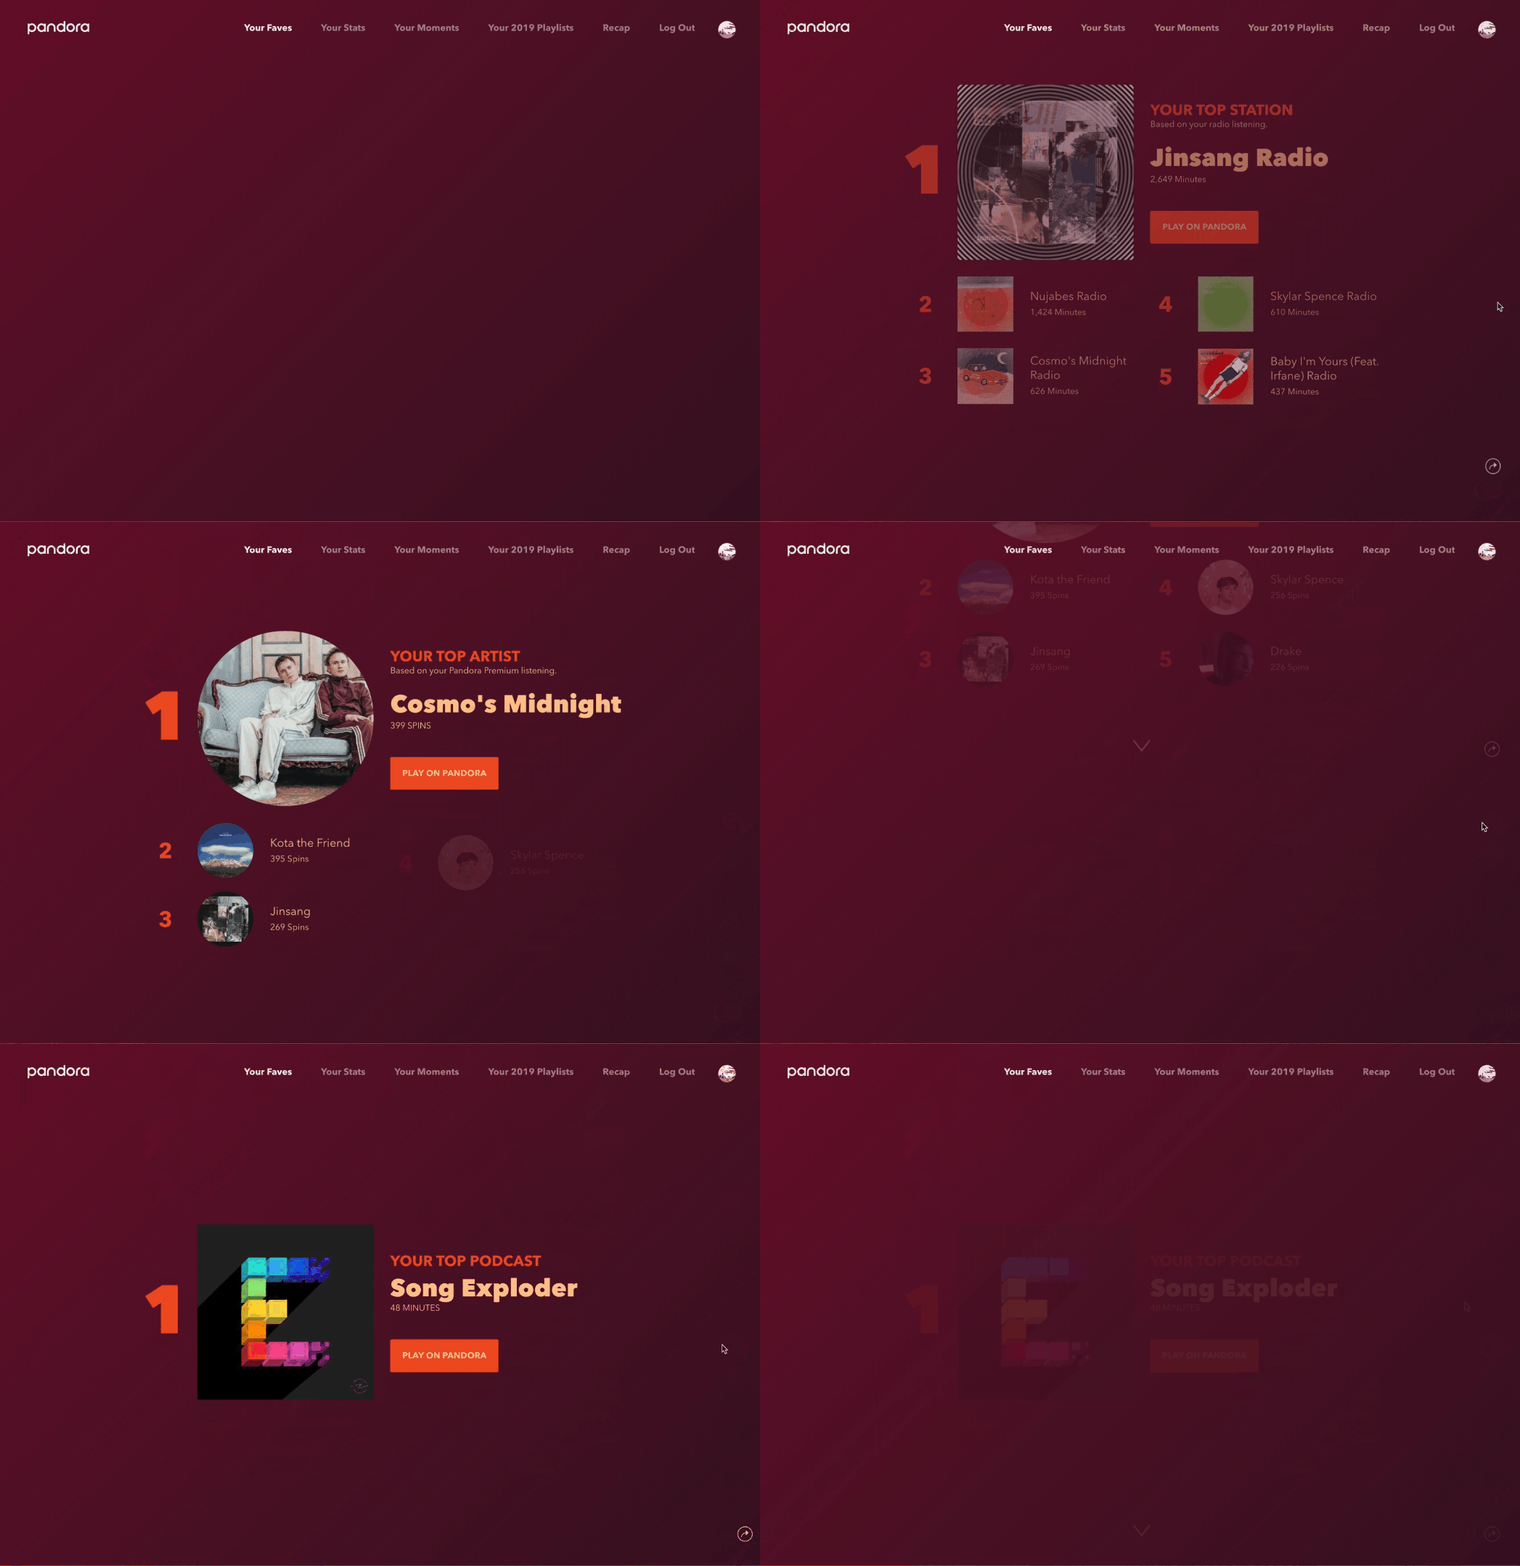
Top Stations / Artists / Albums / Songs / Podcast / Playlists
Strict list of listeners’s top 5s. Various qualifiers for each content type. Grid system implemented to allow 3-up, 4-up, and 5-up pattern to respond to various screen sizes.
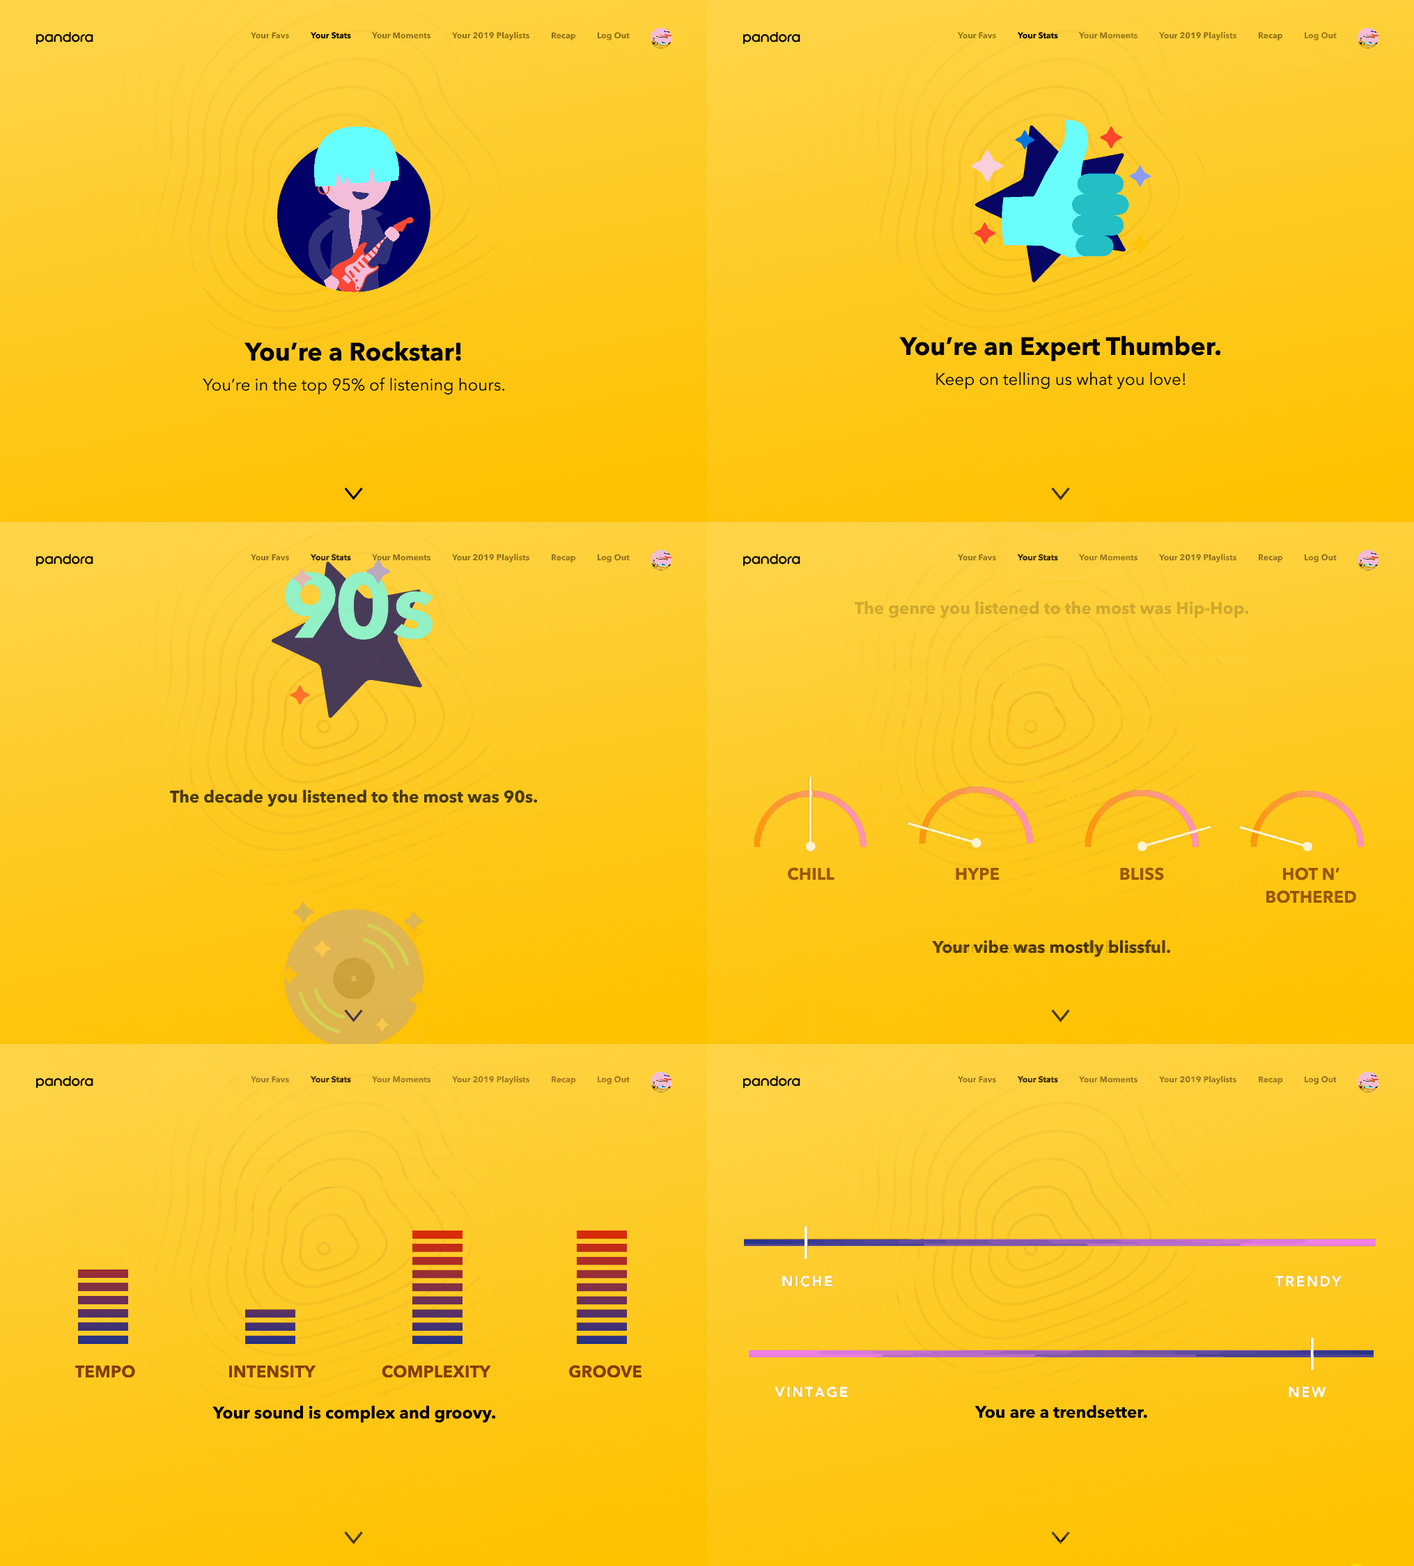
Your Stats
Pandora-specific data:
- Total number of minutes listened
- Total number of Thumbs (likes)
- Analysis of listening history into a most common decade
- Most listened to genre
- Mood/Vibe
- Musical traits
- Indie/Popular scale
Your Moments
- Aggregation of listening history into maximum 6 clusters
- Clusters were algorithmically generated to produce as-even-as-possible splits
- Ad-supported listeners only got stations
- Premium listeners get a mix of all types of content (stations, albums, songs, playlists).
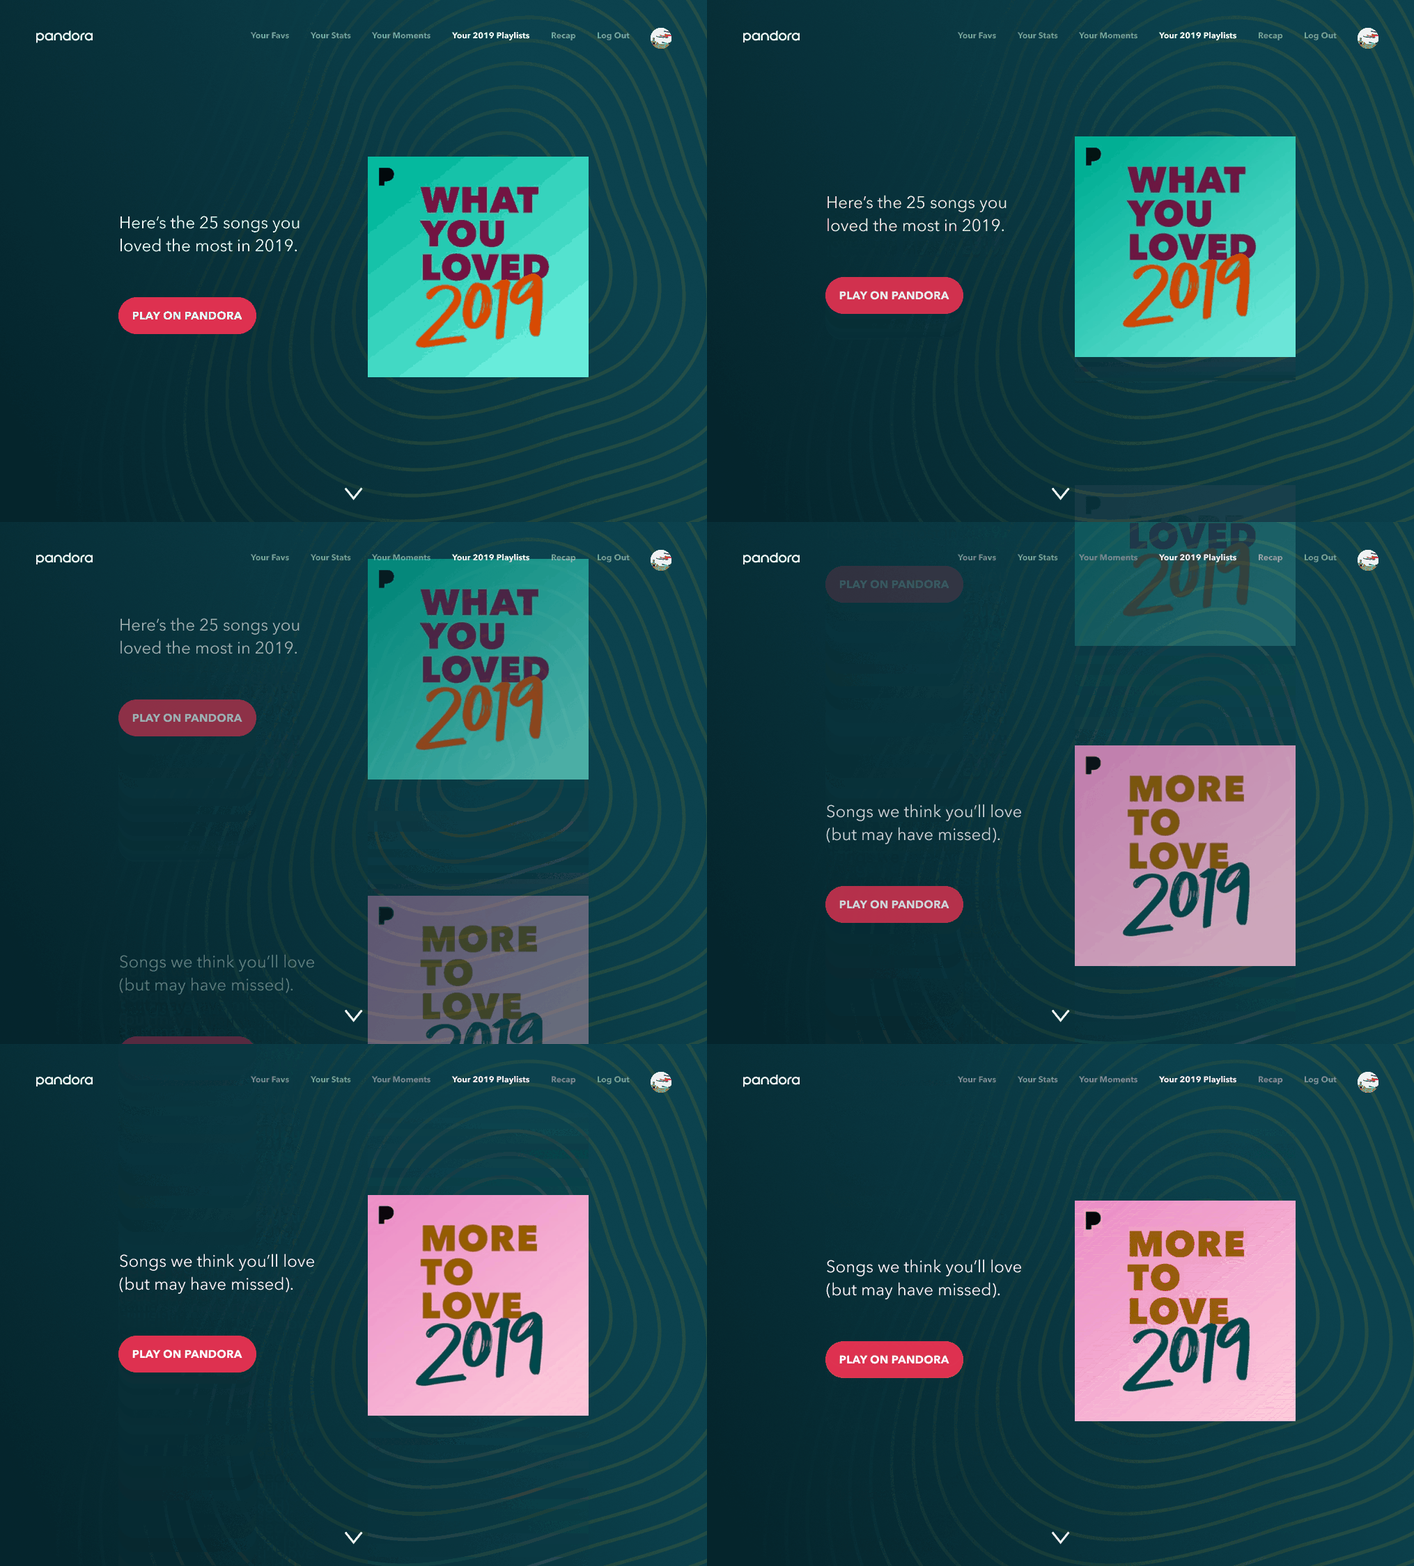
Curated playlists
- What You Loved: 25 most played songs
- More To Love: 25 songs recommended by algorithm
Shareable Asset
- Generated image that users could download and share
- Did not support direct shares to social sites


